
If you’re not aware of the background to this sequence of posts, check out the introduction here
When I was first thinking of how to analyse different neighbourhoods, it was easy to think of the aspects that create the differences as either being intangible – the feel of the area, or very hard to analyse in a statistical way – the age or style of the buildings.
However, when my wife and I first moved to Barcelona almost 6 years ago, I noticed that there a few types of shops and restaurants that I’d enjoyed in other countries that we’d lived in and that were only just starting to appear in Barcelona, and only in certain districts.
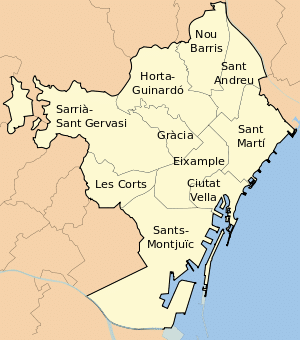
The structure of Barcelona
The city of Barcelona is divided into 10 different districts – for example (Ciutat Vella – which is the whole of the old city), and these are divided into a total of 73 neighbourhoods (For example Ciutat Vella is divided into 4 neighbourhoods, “La Barceloneta”, “El Gòtic”, “El Raval” and “Sant Pere, Santa Caterina i la Ribera”). The neighbourhoods themselves are broken down into sub-neighbourhoods – there are xx for the whole of the city.
For this analysis, i’ll be mainly using the neighbourhoods, to help us get a more granular level of detail.
Grouping neighbourhoods
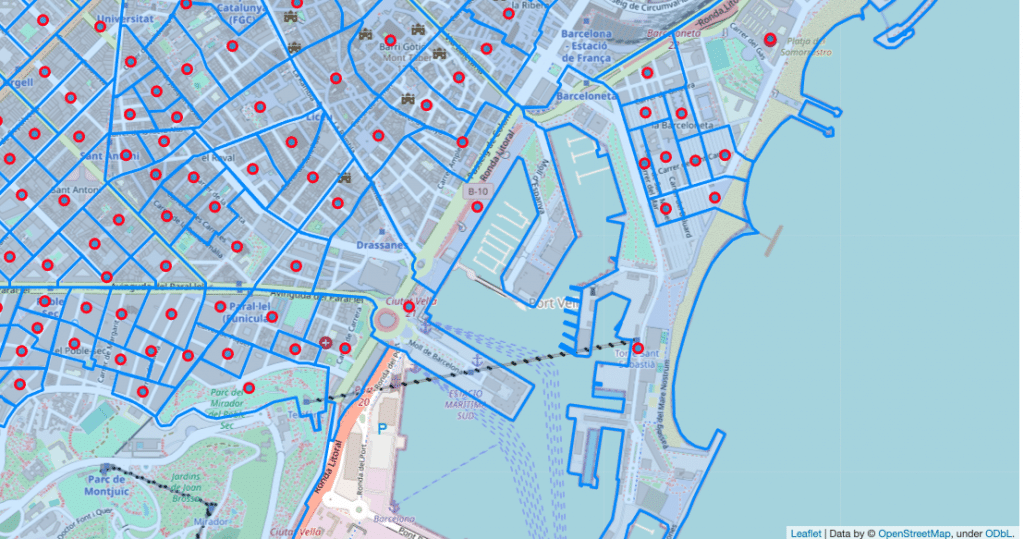
For all of this analysis I used data from Foursquare. I took the sample code that was provided as part of the Coursera course and extended it to allow me to be a lot more accurate in how i placed the venues within each neighbourhood, and also allowed me to pull more than the default 150 venues per query.
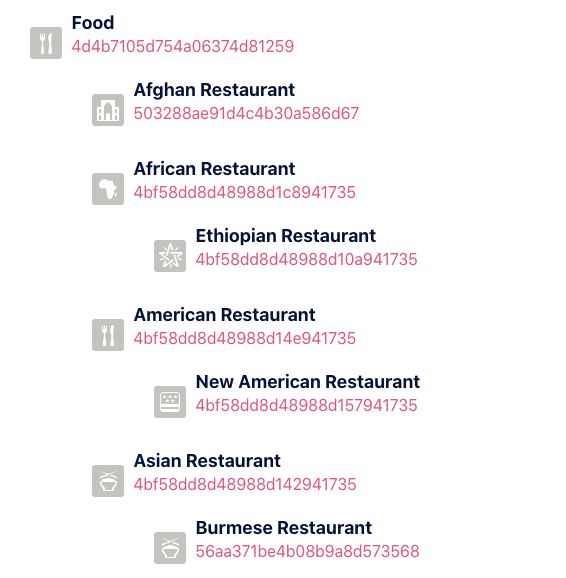
I pulled every single venue in the whole of Barcelona including the venue type and the venue category. The types are very specific, and there’s a taxonomy of how they relate together. In this exercise I’m going to use both the type and the overall category at times.
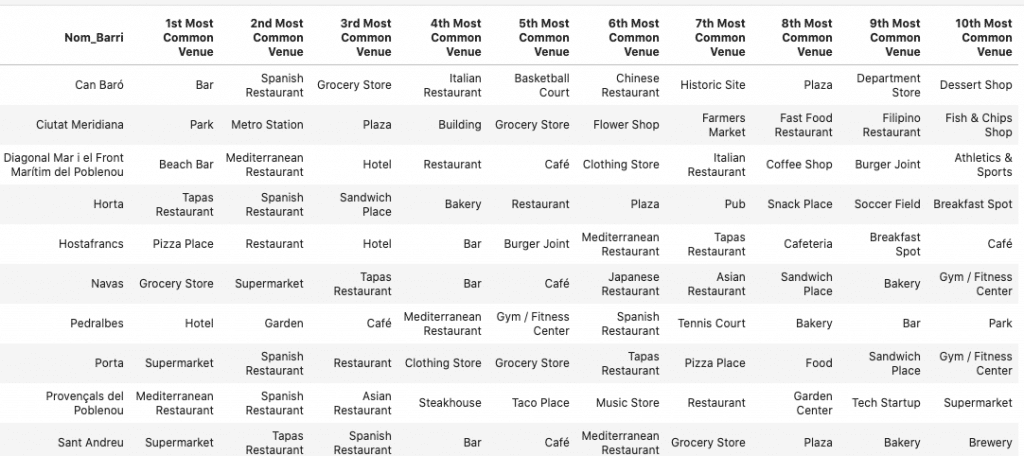
I then summerised all of the Barcelona districts by the most common venue types which is shown in the table below.
Insert table of venue types
So this is informative, but in order to really analyse a neighbourhood’s character, we need to understand the proportion of each venue category. Below is a table showing the numbers of each venue category for each neighjbourhood below
Count table
In order to start comparing things, we need to turn the counts into proportions. This is because a bigger neighbourhood will of course have more of all types of venues than a smaller one, and we’re more interested in the mix than the actual numbers. Below is an example of this.
proportion table
Now we’re able to start analysing things. I knew that I wanted to identify groups of neighbourhoods with a similar mix of venues, but how do we know how many different groups would make most sense, and how should we choose how to perform the grouping? We can use a statistical technique called K-means clustering to help us perform both of these tasks.
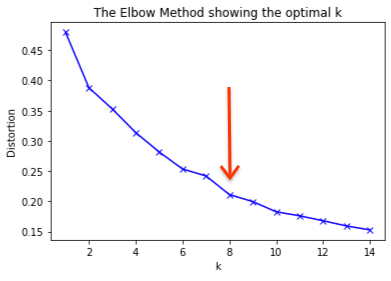
K-means is a technique that where when you give it the number of clusters (groups) that you’re wanting, it will divide the data into that number of groups based on how similar things are, even looking at multiple different metrics. In order to find the optimal number of clusters, we can run it for different numbers, and measure the average amount of difference between each cluster. The more clusters you choose, the more spread out the data, and thus the finer the detail between each cluster. We can graph this, with the number of clusters at the bottom and the difference (distortion) shown at the side and see at what point the line starts to get shallower. From this 8 would seem to be a good number of clusters to choose.
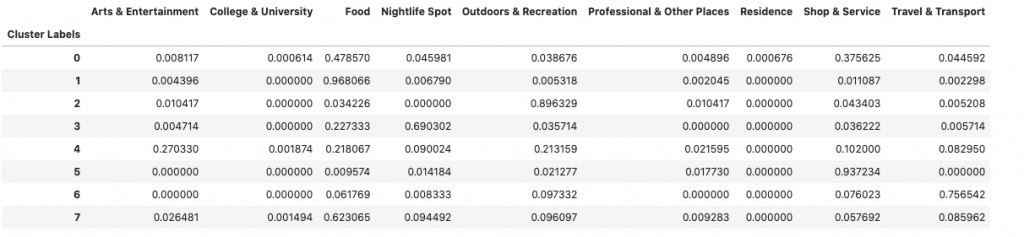
We can then run the K-Means process with 8 clusters, and see the average proportion of each of the venue categories. From this, we can go ahead and give each cluster a name based on the mix of venue types.
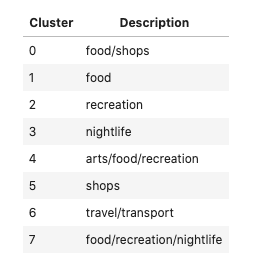
Now we have our clusters, and a rough description, let’s take a look at how they line up across the city.
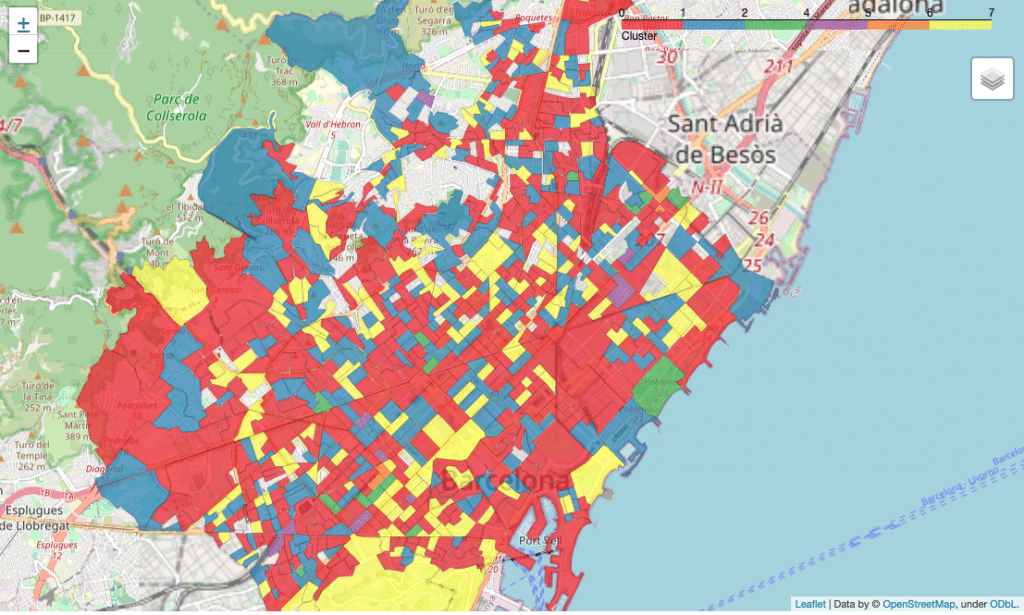
Interresting ,mosaic of different aspects of the city. Looks like they eat out a lot compared to more northern cities.